

The Sanborn map collections for Benzie County
By Jed Jaworski
Current Contributor
“Time travel” is an often held fantasy of many people and is fodder for many books and films. The idea of being able to transport oneself back into any place in time and view how things have changed over the decades and centuries has universal appeal.
Where your home now sits: what did that place look like when it was first built? And who lived there? What home or business may have been built there prior? What did your entire community look like 100 years before your arrival?
A little-known opportunity to have this experience is available through an obscure collection of highly detailed maps and descriptions known as the “Sanborn Fire Insurance Rating Maps.”
Little did Daniel Alfred Sanborn (1827-1883) know in 1866—when he started his own company—that he would go on to create one of the most comprehensive historical records of our communities ever produced:12,000 communities in all. These very detailed, building-level historical maps now provide tremendous values, far beyond their original intent.
The maps were first conceived to give insurance underwriters a contextual view of the community where a property was being underwritten, allowing them to quickly evaluate risk of fire and even negate sending an agent out to do an inspection and a quote. The maps were extremely accurate and regularly updated, so they show and describe the changes that occurred over time in the same format—decade after decade—in each American community.
This provides an invaluable resource for everything from urban planning to historical research. The information to be gleaned is limitless:
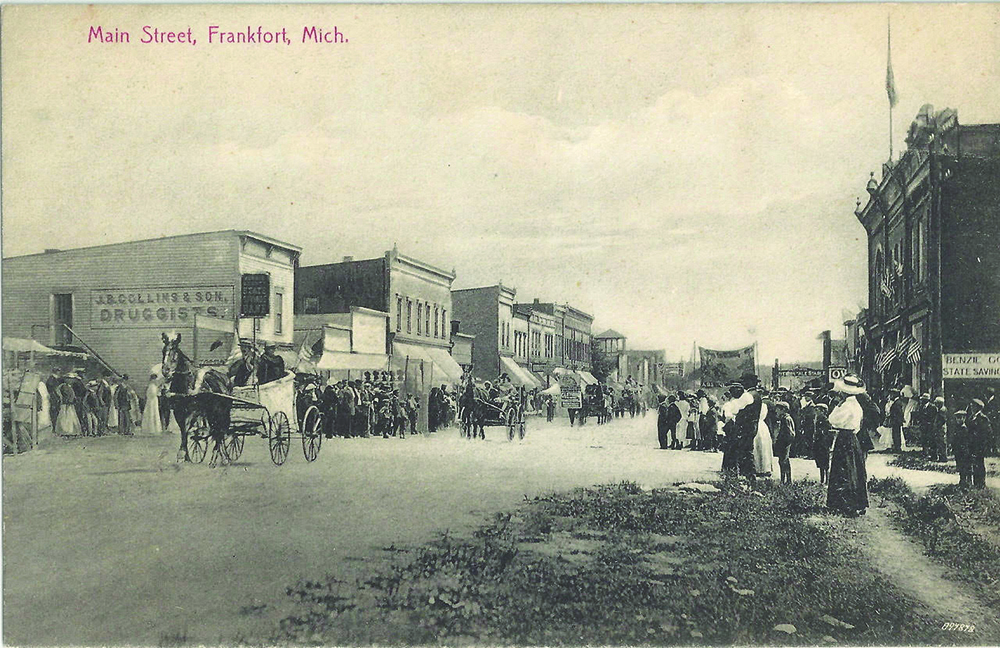
How many schools and churches vs. saloons and brothels? What buildings were workplaces vs. recreational spaces? What type of employment was available? When did electricity or horseless carriages first come to your community, and how did that change its growth over time? How were buildings repurposed as local resources were depleted and employment changed? The change in the Frankfort-Elberta area from a lumber town is one specific example.
“It was accidental in some respect,” Chris Genovese told Bloomberg CityLab back in 2014, when Genovese was general manager at Sanborn, which still offers mapping services with updated technology. When the first maps were made 155 years ago, those at the company surely never imagined that the maps would be of use to anyone other than their insurance-company patrons.
Known largely only to insurance underwriters of yesteryear and today’s research historians, the Sanborn map collections are now in the process of going digitally mainstream as one of the most remarkable resources for time travel into our built environments and understanding the changes that have occurred over the past two centuries. Many maps of villages and cities all over the country are available for free to anyone through the Library of Congress’s website, where the maps have been uploaded over the past few years, and where they continue to be uploaded.
“The Sanborn maps are absolutely invaluable as a resource,” says Kathleen Weessies, head of the Map Library at Michigan State University and the social sciences coordinator for the MSU Libraries. Like the Library of Congress, MSU has many of the Sanborn maps, but they are available only to those affiliated with the university and/or those who make in-person visits—that is because MSU’s collection is through a contract with a private vendor who stipulated this.
What are the maps used for now?
“The people who contact me, what they really want is great detail,” Weessies says. “So many maps are just pretty, but they don’t have a lot of small details. Like a map of the whole state of Michigan can fit on one piece of paper, but there isn’t a lot of detail. People want to see the small details, though.”
Weessies explains that, in order to make a Sanborn-scale map of the entire state, it would take thousands of sheets of paper.
“There just aren’t very many detailed historical maps that are consistently made for the whole state. Sanborn is one of the few. Sure, there are county plat atlases, which have pretty good detail, and they are for most of the state also, but their focus was on rural land and who were the landowners. To be included, you usually had to own 10 acres or more,” Weessies explains. “Sanborn maps are exactly the opposite: they show landowners within a city limit. They were mapped every three to 10 years or so, when the Sanborn agents would come to town and make maps of the city.”
The customers were the insurance companies, Weessies explains, and the companies were supposed to throw away the old maps once the new ones came out. But a few libraries and private individuals got their hands on them, and now many are making their way online.
“If you went to the Library of Congress’s collection online a few years ago and were disappointed not to see your town, you should check again, because they’ve been uploading new maps consistently,” Weessies says. “At least 50 percent of the emails I get are from people who are not affiliated with MSU; they just live in small towns and want to know the history of their street. ‘When was my subdivision built,’ that sort of thing. Sometimes there is a Sanborn map and it’s great; if people are disappointed, it’s often because they live outside of the map. The Sanborn maps really were for city centers.”
While Daniel Sanborn may not have been thinking of the long-term values of his mapping initially, he certainly understood its value to the insurance industry at the time. Having worked as civil engineer and surveyor, Sanborn first completed maps under contract for the Aetna Insurance Company in Tennessee; the company had been impressed with his work on an atlas of Boston.
Seeing a lucrative market for this type of mapping, he formed the “D.A. Sanborn National Insurance Diagram Bureau” in 1867 in New York City. He soon bought out competing firms, and despite his death in 1883, the company name lived on but was shortened in 1902 to the “Sanborn Map Company.”
In 1916, the company purchased the last competitor and became a monopoly. Headquartered in Pelham, New York, there were regional offices in San Francisco, Atlanta, and Chicago. At the peak during the 1920s, the Sanborn Map Company employed 700 people; roughly 300 field surveyors and 400 cartographers who translated the field data on linen-backed sheets using wax stencils, coloring in the maps by hand.
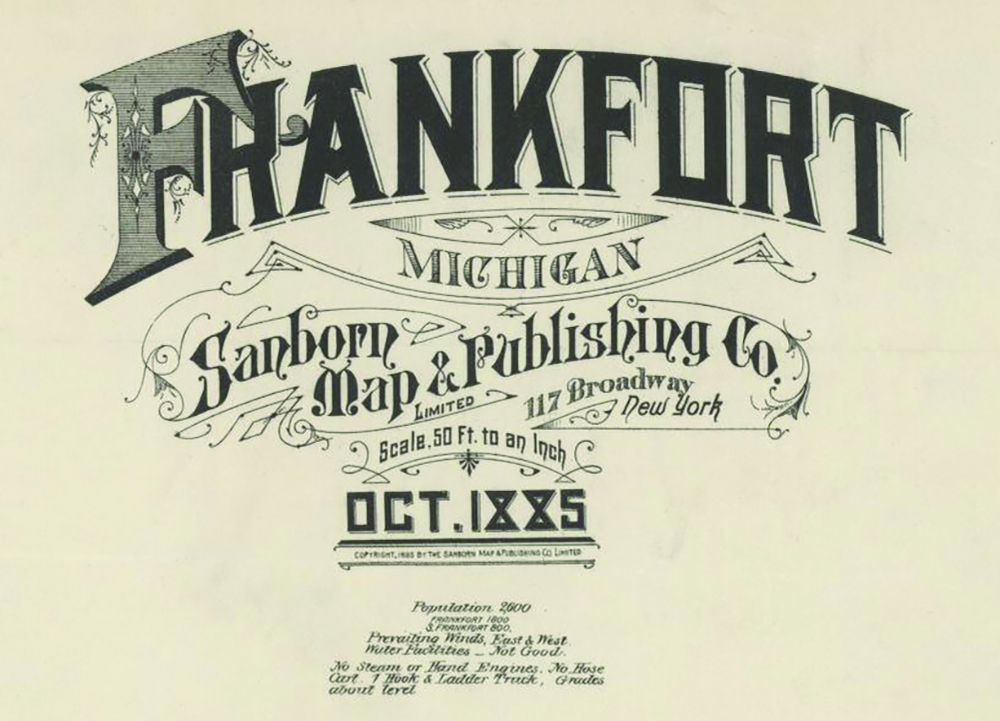
In 1905, a 100-page manual with comprehensive instructions and symbol keys had been released, thus standardizing the maps’ presentation despite being made by hundreds of individual artists. According to the 2014 CityLab article, the artists never signed their work, “but they did add a bit of personal flair when they designed the title pages.”
In an area of intense interest to insurance underwriters, Sanborn would update maps every six months, sending staff out to insert updated information into bound volumes of maps for various clients.
Though the Great Depression of 1929 slowed activity and growth, by the mid-1930s, the firm had recovered. The process of revising entire city maps was a major undertaking, and soon the expansion of cities outpaced the company’s ability to make revisions, so in an efficiency move, they started redoing just the parts of the map that needed updating: “they would then past the updated patches onto the outdated sections of the old map,” according to CityLab.
If the housing units increased in a certain region from one map to another, that suggests that the population of the region was increasing, for instance. The building’s materials could give insight into whether it was affordable housing or an upscale apartment complex. More nuanced changes in a community could be the types of churches that went into a neighborhood over a given period of time.
Additionally, Sanborn maps have been used to look at how diseases move over time and space: Andrew and Jacqueline Curtis of Kent State University plotted clusters of the 1878 yellow fever epidemic by combining New Orleans death records with addresses from the maps in a 2008 white paper.
Moreover, the University of Virginia Library has noted that the 1920 maps of Charlottesville did not include areas that were predominately African-American communities. Genovese told CityLab that if there was, in fact, a selection bias, that in itself reveals a lot about the insurers who commissioned these maps.
However, by the late 1950s, many changes brought about the decline of Sanborn’s business.
Insurance companies were consolidating and needing fewer map collections. Additionally, rating methods changed, plus safer urban planning and building construction techniques and codes reduced risks and the need for maps. The Sanborn Map Co. printed its last catalog in 1950, created its last new map in 1961, and issued its last update in 1977.
Being a monopoly, the company had substantial profits in its heyday and consequently made investments in other companies’ stocks. Interestingly, a young Warren Buffet took note of the declining value of the company with its attractive and diverse investment portfolio. Sanborn stock was $45 a share, but its portfolio was worth $65 a share. So Buffet began buying Sanborn stock, and with some clever maneuvering, managed to secure a 50 percent return on investment within only two years.
Today, the Sanborn Map Company’s greatest legacy is a detailed view of our own legacy—recording in beautiful detail our built environment, how we lived in it, and how we can better plan our future.
To see the Library of Congress’s collection of Sanborn maps, go to LOC.gov/collections/sanborn-maps online; visit LibGuides.lib.msu.edu for more information on Michigan State University’s collection of Sanborn maps. To contact Kathleen Weessies, email weessie2@msu.edu or call 517-884-0849.
Featured Photo Caption: Colorized photo (top) of the Frankfort public school (all grades), circa 1900. The magnificent building was demolished in the 1950s and stood at the present Frankfort Elementary site, located at 6th Street and Leelanau Avenue. According to the 1899 Sanborn map of Frankfort (bottom), the school was heated by a steam boiler fueled by wood and was lit by kerosene. Additionally, located about 150 feet across 6th Street was the sheriff’s department and jail, as well as the Benzie County Courthouse, which was heated by stoves and lit by electric. The Sanborn map collection can help to guide communities with decisions about what structures might be preserved to maintain a community’s sense of place. Photo courtesy of Bob McCall and BaySide Printing Inc. Map courtesy of the Library of Congress.


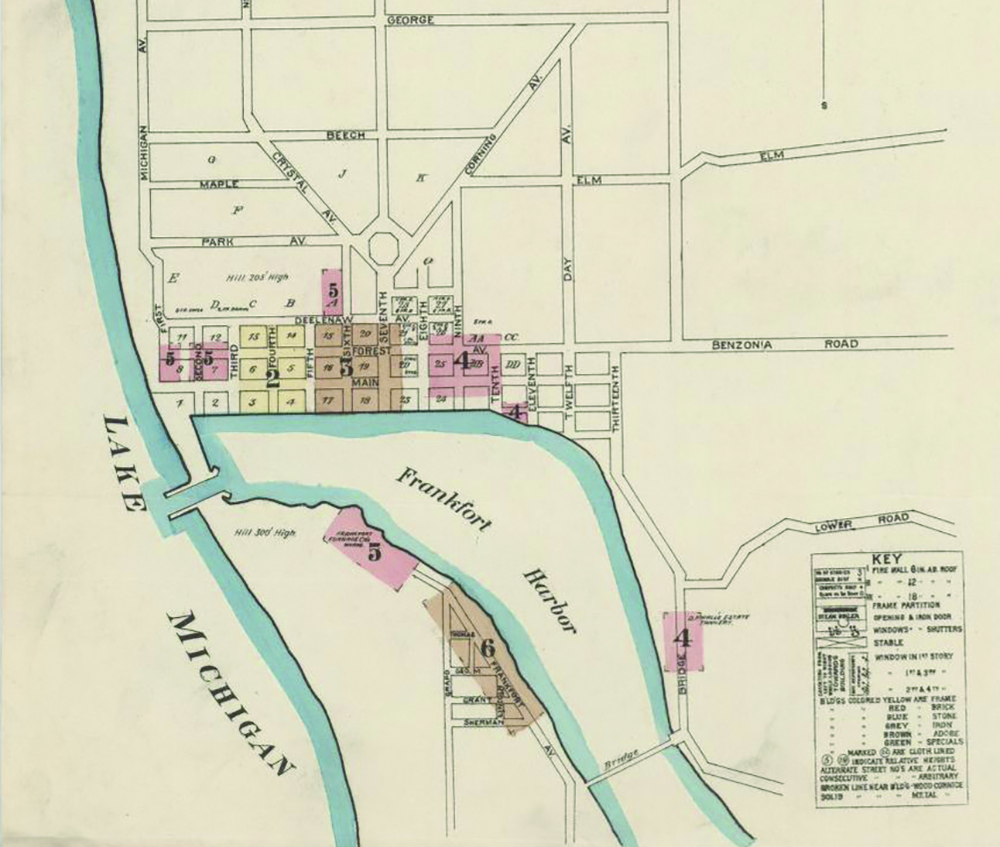
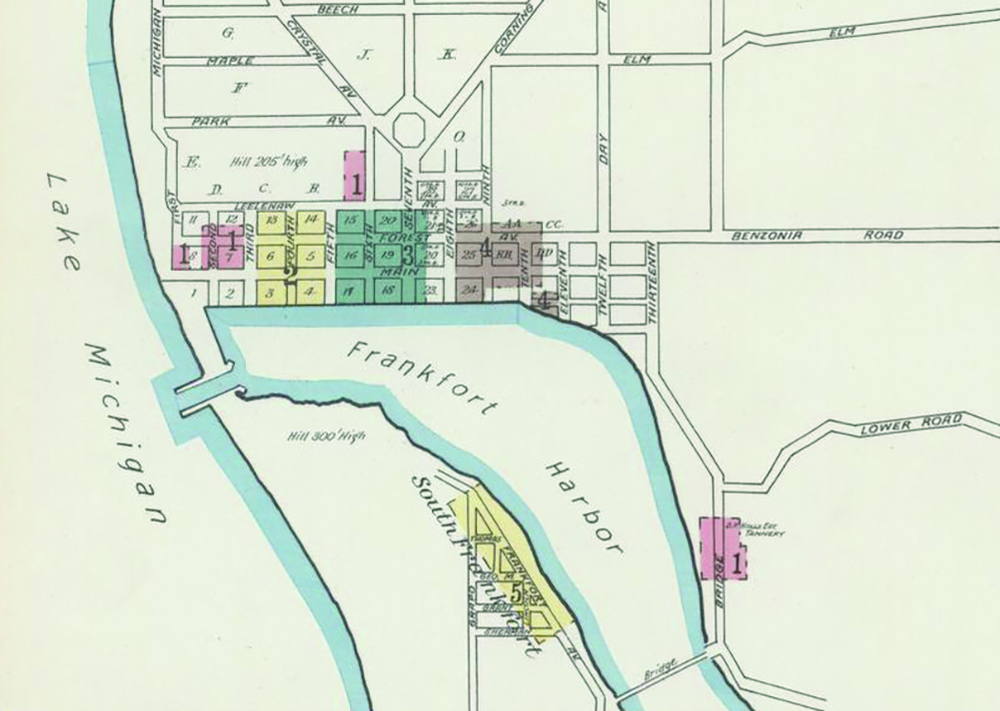
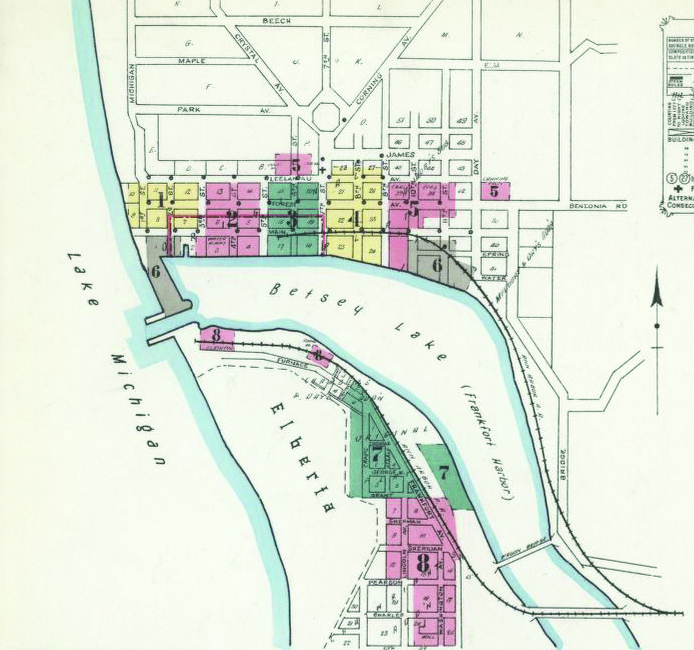
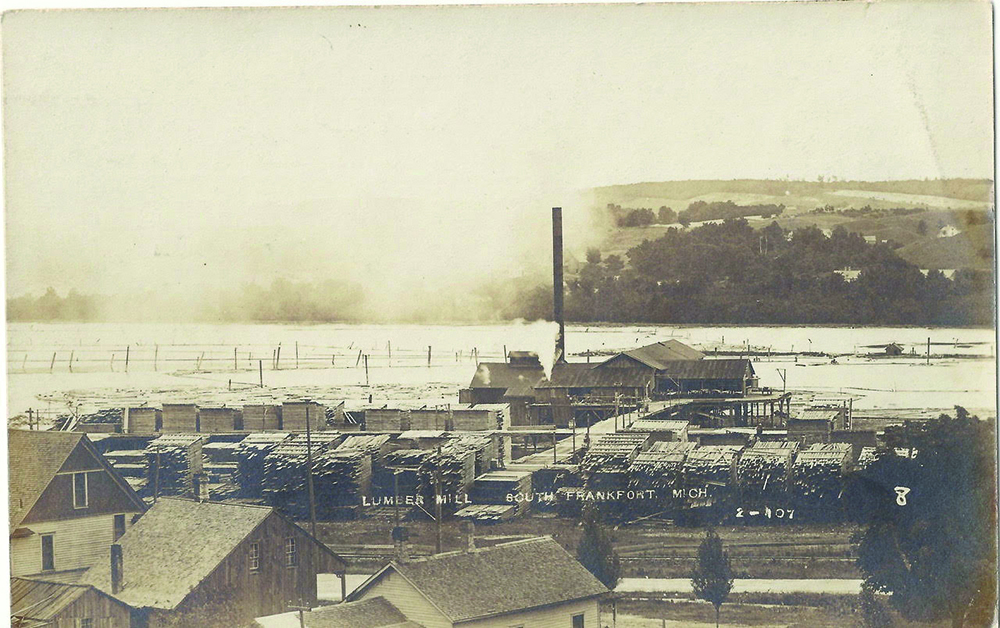
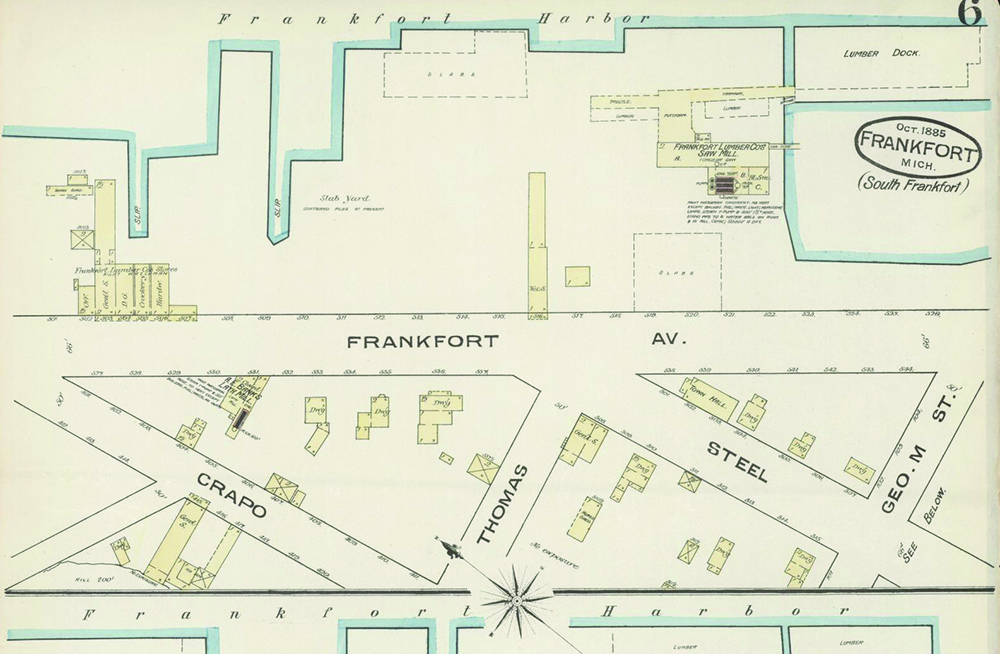
To clarify, the three map pages showing Frankfort/Elberta are Sanborn index pages. And although the color codes mentioned are correct, the colors used for index pages were merely to reference the area included on the indicated page numbers. For example, the third illustration shows pages 1-8, with pages 7 and 8 being the detail pages for Elberta. The structures in the detailed illustration showing Elberta’s Frankfort Ave and lumber mill are colored yellow, indicating they were wood frame buildings. The photo showing the lumber mill is the Crane Lumber Company which was located on property now occupied by Betsie Bay Marina and Cabbage Shed. Incidentally, Crane Lumber owned thousands of acres east of Crystal City (now Beulah) and built a logging railroad from that town on a grade that would later become Narrow Gauge Rd.